signal strength 4 of 5
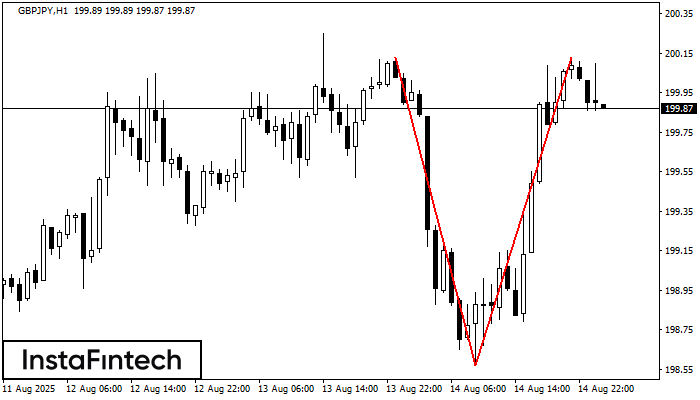
On the chart of GBPJPY H1 the Double Top reversal pattern has been formed. Characteristics: the upper boundary 200.13; the lower boundary 198.57; the width of the pattern 156 points. The signal: a break of the lower boundary will cause continuation of the downward trend targeting the 198.17 level.
یہ بھی دیکھیں
- All
- Double Top
- Flag
- Head and Shoulders
- Pennant
- Rectangle
- Triangle
- Triple top
- All
- #AAPL
- #AMZN
- #Bitcoin
- #EBAY
- #FB
- #GOOG
- #INTC
- #KO
- #MA
- #MCD
- #MSFT
- #NTDOY
- #PEP
- #TSLA
- #TWTR
- AUDCAD
- AUDCHF
- AUDJPY
- AUDUSD
- EURCAD
- EURCHF
- EURGBP
- EURJPY
- EURNZD
- EURRUB
- EURUSD
- GBPAUD
- GBPCHF
- GBPJPY
- GBPUSD
- GOLD
- NZDCAD
- NZDCHF
- NZDJPY
- NZDUSD
- SILVER
- USDCAD
- USDCHF
- USDJPY
- USDRUB
- All
- M5
- M15
- M30
- H1
- D1
- All
- Buy
- Sale
- All
- 1
- 2
- 3
- 4
- 5

The Double Top pattern has been formed on NZDJPY M15. It signals that the trend has been changed from upwards to downwards. Probably, if the base of the pattern 88.60
The M5 and M15 time frames may have more false entry points.
Open chart in a new window
The technical pattern called Head and Shoulders has appeared on the chart of GBPAUD H1. There are weighty reasons to suggest that the price will surpass the Neckline 2.0248/2.0245 after
Open chart in a new window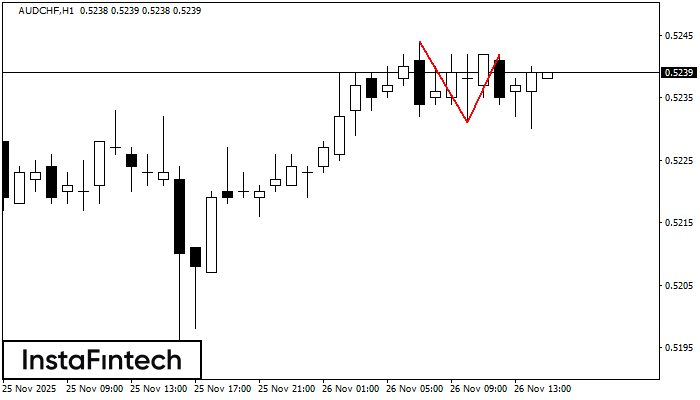
On the chart of AUDCHF H1 the Double Top reversal pattern has been formed. Characteristics: the upper boundary 0.5242; the lower boundary 0.5231; the width of the pattern 11 points
Open chart in a new window