signal strength 3 of 5

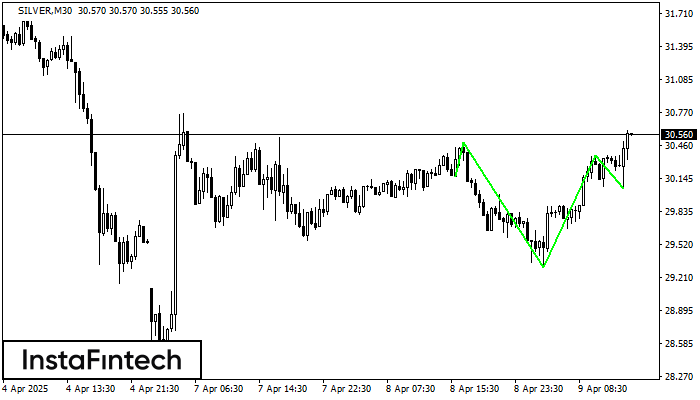
According to the chart of M30, SILVER formed the Inverse Head and Shoulder pattern. The Head’s top is set at 30.37 while the median line of the Neck is found at 29.30/30.05. The formation of the Inverse Head and Shoulder pattern evidently signals a reversal of the downward trend. In other words, in case the scenario comes true, the price of SILVER will go towards 30.40
Xem thêm
- All
- Double Top
- Flag
- Head and Shoulders
- Pennant
- Rectangle
- Triangle
- Triple top
- All
- #AAPL
- #AMZN
- #Bitcoin
- #EBAY
- #FB
- #GOOG
- #INTC
- #KO
- #MA
- #MCD
- #MSFT
- #NTDOY
- #PEP
- #TSLA
- #TWTR
- AUDCAD
- AUDCHF
- AUDJPY
- AUDUSD
- EURCAD
- EURCHF
- EURGBP
- EURJPY
- EURNZD
- EURRUB
- EURUSD
- GBPAUD
- GBPCHF
- GBPJPY
- GBPUSD
- GOLD
- NZDCAD
- NZDCHF
- NZDJPY
- NZDUSD
- SILVER
- USDCAD
- USDCHF
- USDJPY
- USDRUB
- All
- M5
- M15
- M30
- H1
- D1
- All
- Buy
- Sale
- All
- 1
- 2
- 3
- 4
- 5
According to the chart of M5, NZDJPY formed the Bullish Symmetrical Triangle pattern, which signals the trend will continue. Description. The upper border of the pattern touches the coordinates 86.66/86.55
The M5 and M15 time frames may have more false entry points.
Open chart in a new windowAccording to the chart of M5, AUDCAD formed the Bullish Symmetrical Triangle pattern. The lower border of the pattern touches the coordinates 0.9117/0.9128 whereas the upper border goes across 0.9137/0.9128
The M5 and M15 time frames may have more false entry points.
Open chart in a new windowAccording to the chart of M5, GBPAUD formed the Bullish Symmetrical Triangle pattern. Description: This is the pattern of a trend continuation. 2.0519 and 2.0413 are the coordinates
The M5 and M15 time frames may have more false entry points.
Open chart in a new window