signal strength 3 of 5

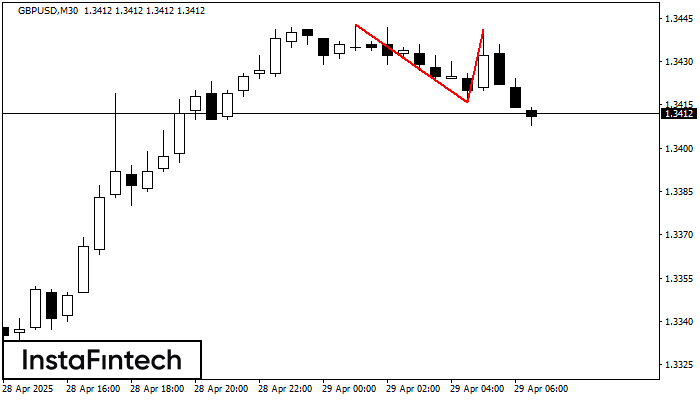
On the chart of GBPUSD M30 the Double Top reversal pattern has been formed. Characteristics: the upper boundary 1.3441; the lower boundary 1.3416; the width of the pattern 25 points. The signal: a break of the lower boundary will cause continuation of the downward trend targeting the 1.3386 level.
Vea asimismo
- All
- Double Top
- Flag
- Head and Shoulders
- Pennant
- Rectangle
- Triangle
- Triple top
- All
- #AAPL
- #AMZN
- #Bitcoin
- #EBAY
- #FB
- #GOOG
- #INTC
- #KO
- #MA
- #MCD
- #MSFT
- #NTDOY
- #PEP
- #TSLA
- #TWTR
- AUDCAD
- AUDCHF
- AUDJPY
- AUDUSD
- EURCAD
- EURCHF
- EURGBP
- EURJPY
- EURNZD
- EURRUB
- EURUSD
- GBPAUD
- GBPCHF
- GBPJPY
- GBPUSD
- GOLD
- NZDCAD
- NZDCHF
- NZDJPY
- NZDUSD
- SILVER
- USDCAD
- USDCHF
- USDJPY
- USDRUB
- All
- M5
- M15
- M30
- H1
- D1
- All
- Buy
- Sale
- All
- 1
- 2
- 3
- 4
- 5
Según el gráfico de M30, NZDUSD formó el Rectángulo Alcista. Este tipo de patrón indica la continuación de una tendencia. Esto consiste de dos niveles: resistencia 0.5976 y soporte 0.5955
Open chart in a new windowSegún el gráfico de M15, NZDUSD formó el Rectángulo Alcista. El patrón indica la continuación de una tendencia. El límite superior es 0.5976, el límite inferior es 0.5955. La señal
Los marcos de tiempo M5 y M15 pueden tener más puntos de entrada falsos.
Open chart in a new windowEl patrón Doble Piso ha sido formado en GBPUSD M5; el límite superior es 1.3556; el límite inferior es 1.3551. El ancho del patrón es 5 puntos. En caso
Los marcos de tiempo M5 y M15 pueden tener más puntos de entrada falsos.
Open chart in a new window