On the hourly chart, the GBP/USD pair continued its upward move on Wednesday and reached the 100.0% retracement level at 1.3586, which borders the resistance area of 1.3611–1.3620. A rebound from either of these resistance levels could signal a reversal in favor of the U.S. dollar and a decline toward 1.3482. A close above the 1.3611–1.3620 zone would increase the likelihood of further growth toward the next 127.2% retracement level at 1.3708.
The wave structure remains "bearish," which is unusual after two weeks of growth. The last completed upward wave broke the highs of the previous two waves, but the last downward wave also broke all prior lows. Therefore, the trend can still be considered "bearish," but the news background has played a significant role in shaping it. In my view, the news background has already shifted the pair toward the bulls, so the trend may soon turn "bullish" again. The situation remains ambiguous and depends largely on incoming news.
There was no significant news on Wednesday, but this morning the UK released rather optimistic reports that allow the bulls to keep pressing forward. The UK economy grew in the second quarter by 0.3% q/q, 1.2% y/y, and 0.4% m/m versus forecasts of 0.1%, 1.0%, and 0.1%, respectively. Thus, GDP growth figures in all three variations exceeded expectations. Industrial production also performed better, rising by 0.7% m/m in June compared to the expected +0.2%. Bullish traders are not rushing to launch a new offensive yet, as tomorrow's developments carry much more significance for GBP/USD prospects. If the talks in Alaska fail, the bears could briefly take control. However, they are unlikely to sustain the attack for long, as the FOMC is expected to resume monetary policy easing next month. Still, one downward wave is quite possible.
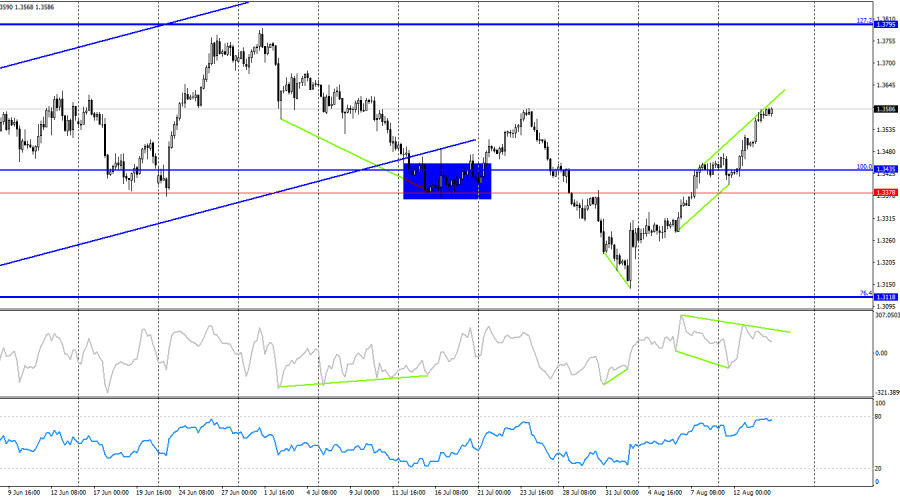
On the 4-hour chart, the pair reversed in favor of the pound after a "bullish" divergence formed on the CCI indicator and closed above the 1.3378–1.3435 resistance zone. Thus, the growth process could continue toward the next Fibonacci level at 1.3795. However, a "bearish" divergence is now forming on the CCI, suggesting a possible small decline, which also coincides with important resistance levels on the hourly chart.
Commitments of Traders (COT) Report:
The sentiment of the "Non-commercial" category of traders became more "bearish" over the last reporting week. The number of long positions held by speculators decreased by 22,164, while short positions fell by 889. However, the sharp drop in interest toward the pound shown in the COT reports does not fully reflect the real market picture, as interest in the dollar is also declining. The gap between long and short positions is now approximately 65,000 versus 98,000. Nevertheless, the pound continues to rise.
In my opinion, the pound still faces the risk of a decline. The news background for the U.S. dollar during the first six months of the year was extremely negative, but it is slowly starting to improve. Trade tensions are easing, key deals are being signed, and the U.S. economy in the second quarter is likely to recover thanks to tariffs and various investments into the U.S. economy. At the same time, the prospect of FOMC monetary policy easing in the second half of the year could place significant pressure on the dollar.
News calendar for the U.S. and the UK:
- UK – Industrial Production m/m (06:00 UTC)
- UK – Q2 GDP Change (06:00 UTC)
- U.S. – Producer Price Index (12:30 UTC)
- U.S. – Initial Jobless Claims (12:30 UTC)
On August 14, the economic calendar contains four entries, two of which have already been released, while the remaining two are of low importance. The impact of the news background on market sentiment for the rest of the day is expected to be weak.
GBP/USD forecast and trader recommendations: Selling opportunities today are possible in case of a rebound from the 1.3586 level or the 1.3611–1.3620 zone on the hourly chart, targeting 1.3482. Buying opportunities previously required a rebound from the 1.3114–1.3139 zone. Those trades were advised to be kept open with targets at 1.3357–1.3371, 1.3425, 1.3470, and 1.3586. All targets have been reached. New long positions may be opened if the pair closes above the 1.3611–1.3620 zone.
The Fibonacci grids are built from 1.3586–1.3139 on the hourly chart and from 1.3431–1.2104 on the 4-hour chart.