signal strength 1 of 5
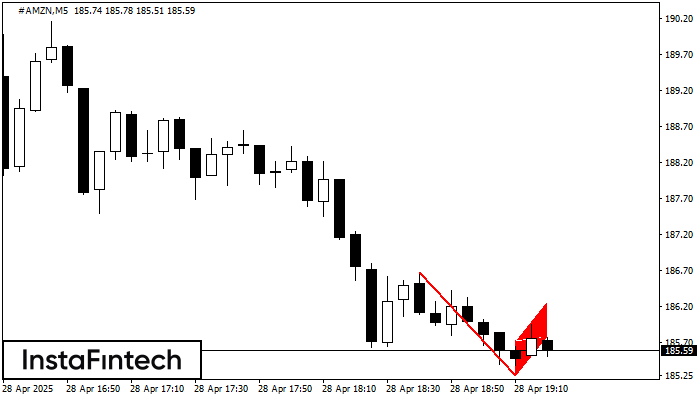
The Bearish Flag pattern has been formed on the chart #AMZN M5 which signals that the downward trend will continue. If the price breaks below the low at 185.25, then it is most likely to move further downwards. The price will likely move by the number of points which equals the length of the flag pole (10 points).
The M5 and M15 time frames may have more false entry points.
See Also
- All
- Double Top
- Flag
- Head and Shoulders
- Pennant
- Rectangle
- Triangle
- Triple top
- All
- #AAPL
- #AMZN
- #Bitcoin
- #EBAY
- #FB
- #GOOG
- #INTC
- #KO
- #MA
- #MCD
- #MSFT
- #NTDOY
- #PEP
- #TSLA
- #TWTR
- AUDCAD
- AUDCHF
- AUDJPY
- AUDUSD
- EURCAD
- EURCHF
- EURGBP
- EURJPY
- EURNZD
- EURRUB
- EURUSD
- GBPAUD
- GBPCHF
- GBPJPY
- GBPUSD
- GOLD
- NZDCAD
- NZDCHF
- NZDJPY
- NZDUSD
- SILVER
- USDCAD
- USDCHF
- USDJPY
- USDRUB
- All
- M5
- M15
- M30
- H1
- D1
- All
- Buy
- Sale
- All
- 1
- 2
- 3
- 4
- 5
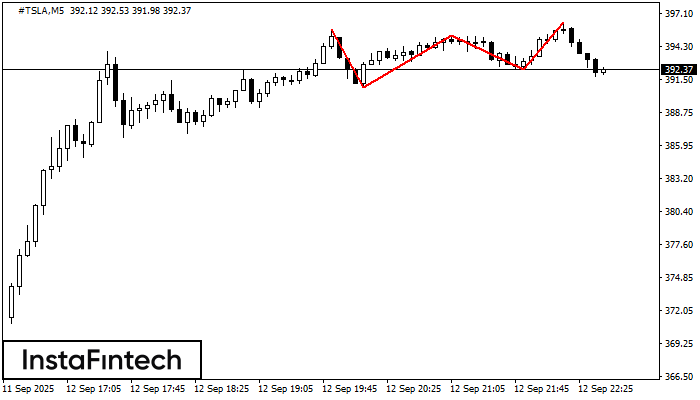
En el gráfico del instrumento de negociación #TSLA M5, se ha formado el patrón Triple Techo que señala un cambio en la tendencia. Es posible que después de la formación
Los marcos de tiempo M5 y M15 pueden tener más puntos de entrada falsos.
Open chart in a new window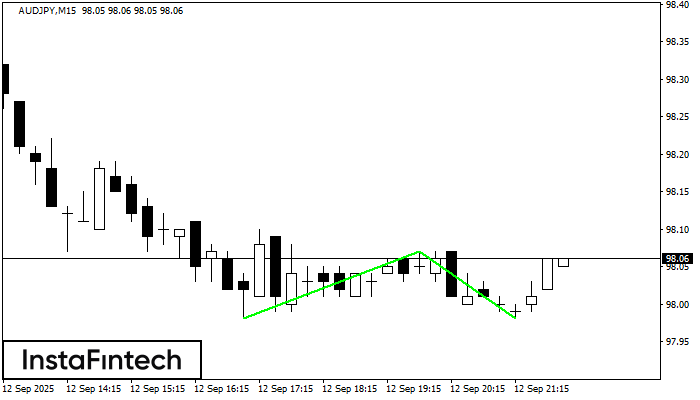
El patrón Doble Piso ha sido formado en AUDJPY M15. Características: el nivel de soporte 97.98; el nivel de resistencia 98.07; el ancho del patrón 9 puntos. Si el nivel
Los marcos de tiempo M5 y M15 pueden tener más puntos de entrada falsos.
Open chart in a new window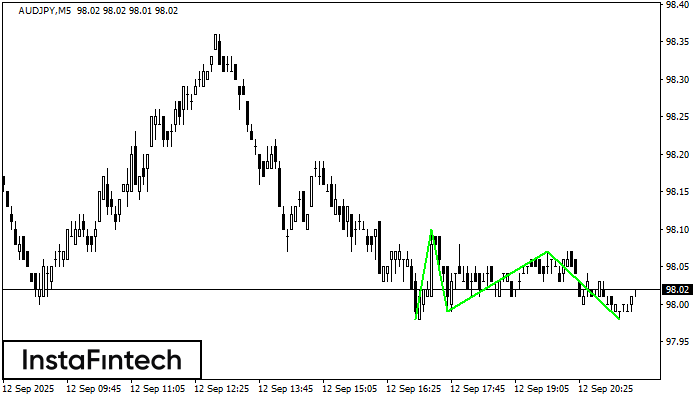
El patrón Triple Piso ha sido formado en AUDJPY M5. Este tiene las siguientes características: nivel de resistencia 98.10/98.07; nivel de soporte 97.98/97.98; el ancho es 12 puntos. En caso
Los marcos de tiempo M5 y M15 pueden tener más puntos de entrada falsos.
Open chart in a new window