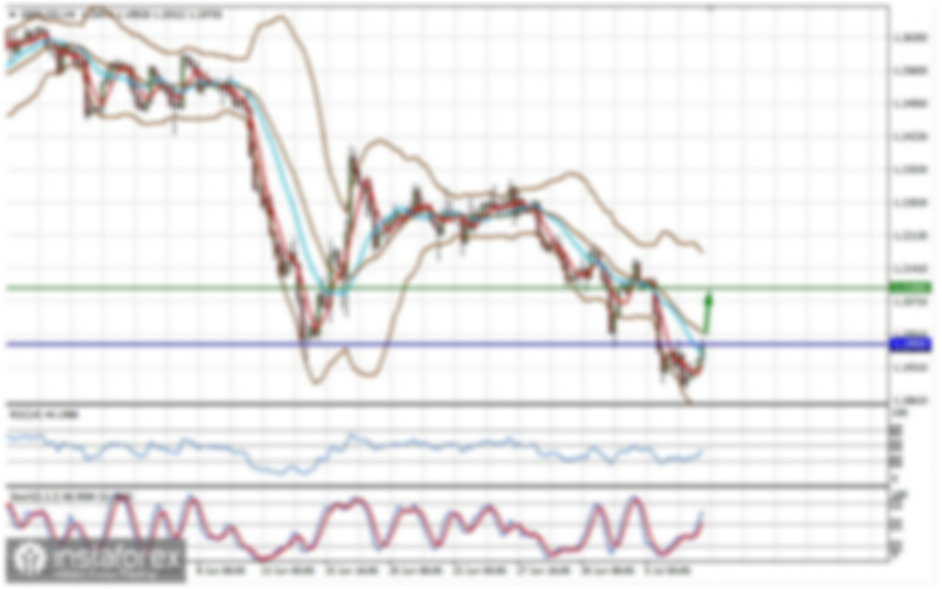
On Thursday, the EUR/USD pair returned to the 76.4% Fibonacci retracement level at 1.1454, rebounded from it, and reversed in favor of the US dollar. However, the bears failed to maintain the downward momentum. Another rebound from the 1.1454 level today would again support the US dollar and signal a potential decline toward the support zone at 1.1374–1.1380. If the pair consolidates above 1.1454, traders may expect continued growth toward the 100.0% retracement level at 1.1574.
The wave pattern on the hourly chart remains simple and clear. The last completed upward wave broke the previous high, while the latest downward wave broke the previous low. Thus, the current trend is considered bearish, although it has been shifting frequently due to the news background. Donald Trump managed to sign several favorable deals, which has supported the bearish sentiment, as have Jerome Powell's comments following the latest Fed meeting. However, this support for the bears may prove temporary.
On Thursday, traders turned their attention to European statistics, although the volume and significance of the data were objectively lower than in the US. Germany's unemployment rate remained at 6.3% against expectations. The eurozone's unemployment rate also stayed at 6.2%, and Germany's consumer price index held steady at 2%, all contrary to forecasts. In the US, the personal consumption expenditures price index rose by 0.3%, in line with market expectations. Personal income and spending figures also largely matched forecasts. As a result, neither bulls nor bears had strong reasons to initiate new moves. Nonetheless, bears currently hold the market initiative, and the US dollar continues to benefit from the favorable news flow. Trump is signing deals advantageous to the US, the Federal Reserve maintains a hawkish stance, and the US economy continues to show strong growth.
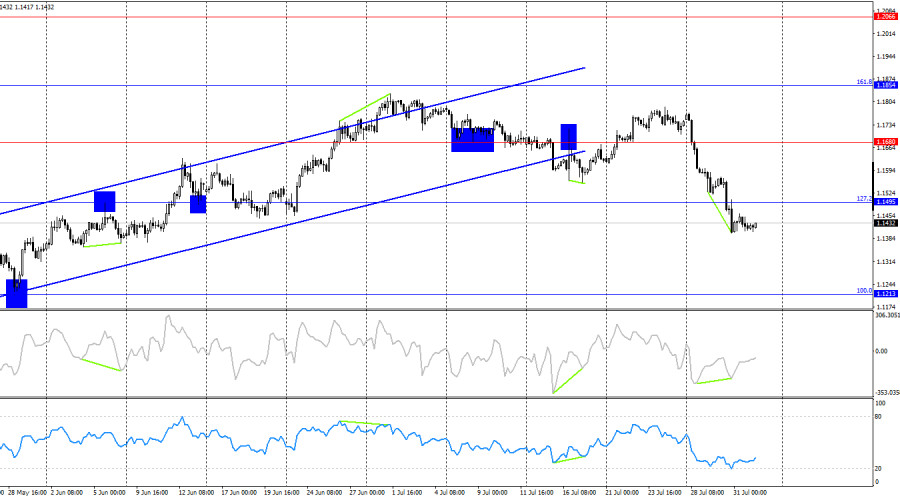
On the four-hour chart, the pair reversed in favor of the US dollar and closed below the 127.2% Fibonacci level at 1.1495. Earlier, the euro had also closed below the ascending trend channel. Still, I remain cautious about concluding that a full-fledged bearish trend has begun. The EU–US trade deal has supported the bearish sentiment, but a sustained and consistent bearish news backdrop is needed for a continued decline toward the next retracement level at 1.1213. A bullish divergence has formed on the CCI indicator, signaling a potential reversal in favor of the euro.
Commitments of Traders (COT) report:
During the most recent reporting week, professional traders opened 6,284 long positions and 8,990 short positions. The sentiment of the "Non-commercial" group remains bullish, largely due to Donald Trump, and is strengthening over time. The total number of long positions held by speculators now stands at 248,000, compared to 122,000 short positions—a gap of more than twofold. Also, note the number of green cells in the table above, indicating a strong build-up of euro positions. In most cases, interest in the euro continues to grow, while interest in the dollar declines.
For 24 consecutive weeks, large players have been reducing short positions and increasing long ones. Donald Trump's policy remains the most influential factor for traders, as it may lead to a recession in the US economy and other long-term structural challenges. Despite several major trade deals being signed, I do not yet see a shift in sentiment among large market participants.
Economic calendar for the US and the eurozone:
- Eurozone – Consumer Price Index (09:00 UTC)
- US – Change in Nonfarm Payrolls (12:30 UTC)
- US – Unemployment Rate (12:30 UTC)
- US – Change in Average Hourly Earnings (12:30 UTC)
- US – ISM Manufacturing PMI (14:00 UTC)
The economic calendar for August 1 contains five important entries. The impact of the news background on market sentiment will be strong throughout Friday.
EUR/USD forecast and trading recommendations:
Selling opportunities were available after the pair consolidated below 1.1712, with targets at 1.1645, 1.1574, and 1.1454. All targets have been reached. New selling opportunities appeared on the rebound from 1.1454, with a target at 1.1374–1.1380. Today, buying can be considered either after a close above 1.1454 with a target at 1.1574 or following a rebound from the 1.1374–1.1380 zone.
The Fibonacci levels are based on 1.1574–1.1066 on the hourly chart and 1.1214–1.0179 on the four-hour chart.