signal strength 1 of 5
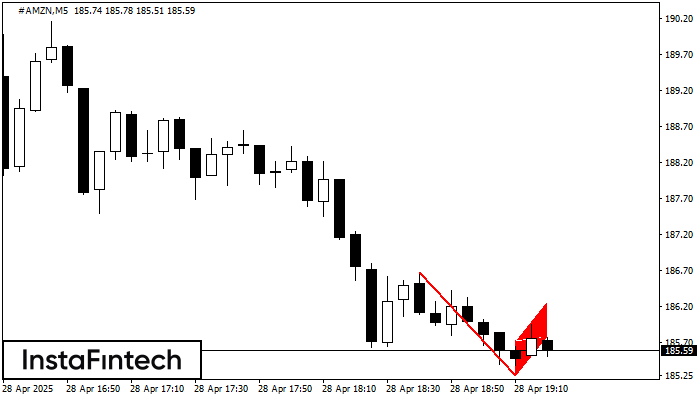
The Bearish Flag pattern has been formed on the chart #AMZN M5 which signals that the downward trend will continue. If the price breaks below the low at 185.25, then it is most likely to move further downwards. The price will likely move by the number of points which equals the length of the flag pole (10 points).
The M5 and M15 time frames may have more false entry points.
See Also
- All
- Double Top
- Flag
- Head and Shoulders
- Pennant
- Rectangle
- Triangle
- Triple top
- All
- #AAPL
- #AMZN
- #Bitcoin
- #EBAY
- #FB
- #GOOG
- #INTC
- #KO
- #MA
- #MCD
- #MSFT
- #NTDOY
- #PEP
- #TSLA
- #TWTR
- AUDCAD
- AUDCHF
- AUDJPY
- AUDUSD
- EURCAD
- EURCHF
- EURGBP
- EURJPY
- EURNZD
- EURRUB
- EURUSD
- GBPAUD
- GBPCHF
- GBPJPY
- GBPUSD
- GOLD
- NZDCAD
- NZDCHF
- NZDJPY
- NZDUSD
- SILVER
- USDCAD
- USDCHF
- USDJPY
- USDRUB
- All
- M5
- M15
- M30
- H1
- D1
- All
- Buy
- Sale
- All
- 1
- 2
- 3
- 4
- 5
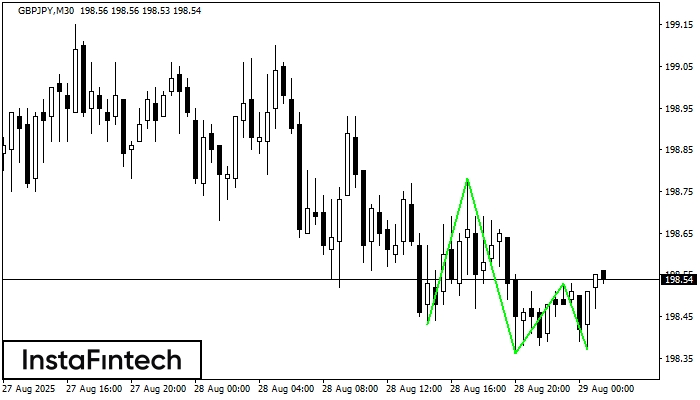
The Triple Bottom pattern has been formed on GBPJPY M30. It has the following characteristics: resistance level 198.78/198.53; support level 198.43/198.37; the width is 35 points. In the event
Open chart in a new window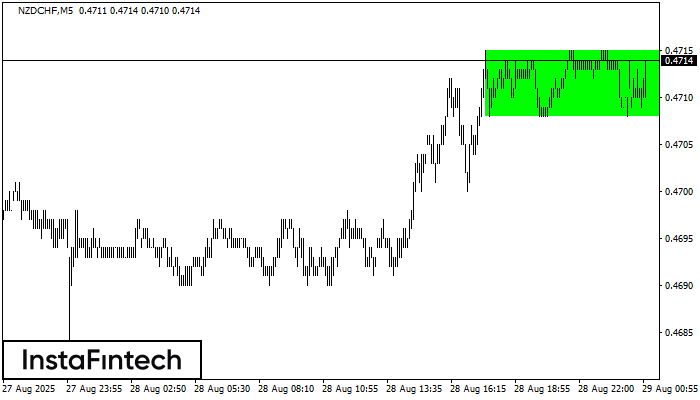
According to the chart of M5, NZDCHF formed the Bullish Rectangle. This type of a pattern indicates a trend continuation. It consists of two levels: resistance 0.4715 and support 0.4708
The M5 and M15 time frames may have more false entry points.
Open chart in a new window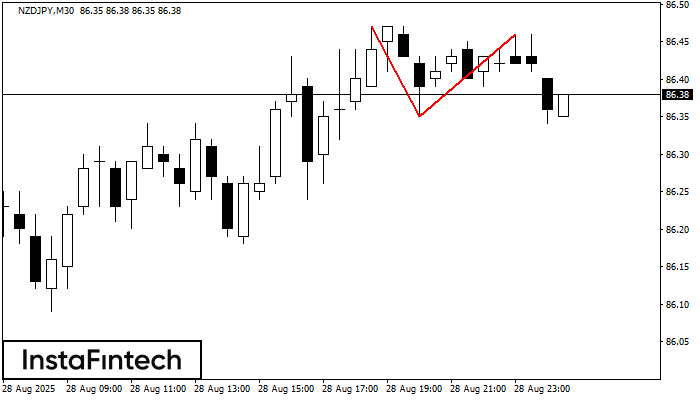
On the chart of NZDJPY M30 the Double Top reversal pattern has been formed. Characteristics: the upper boundary 86.46; the lower boundary 86.35; the width of the pattern 11 points
Open chart in a new window