Trade Analysis for Thursday:
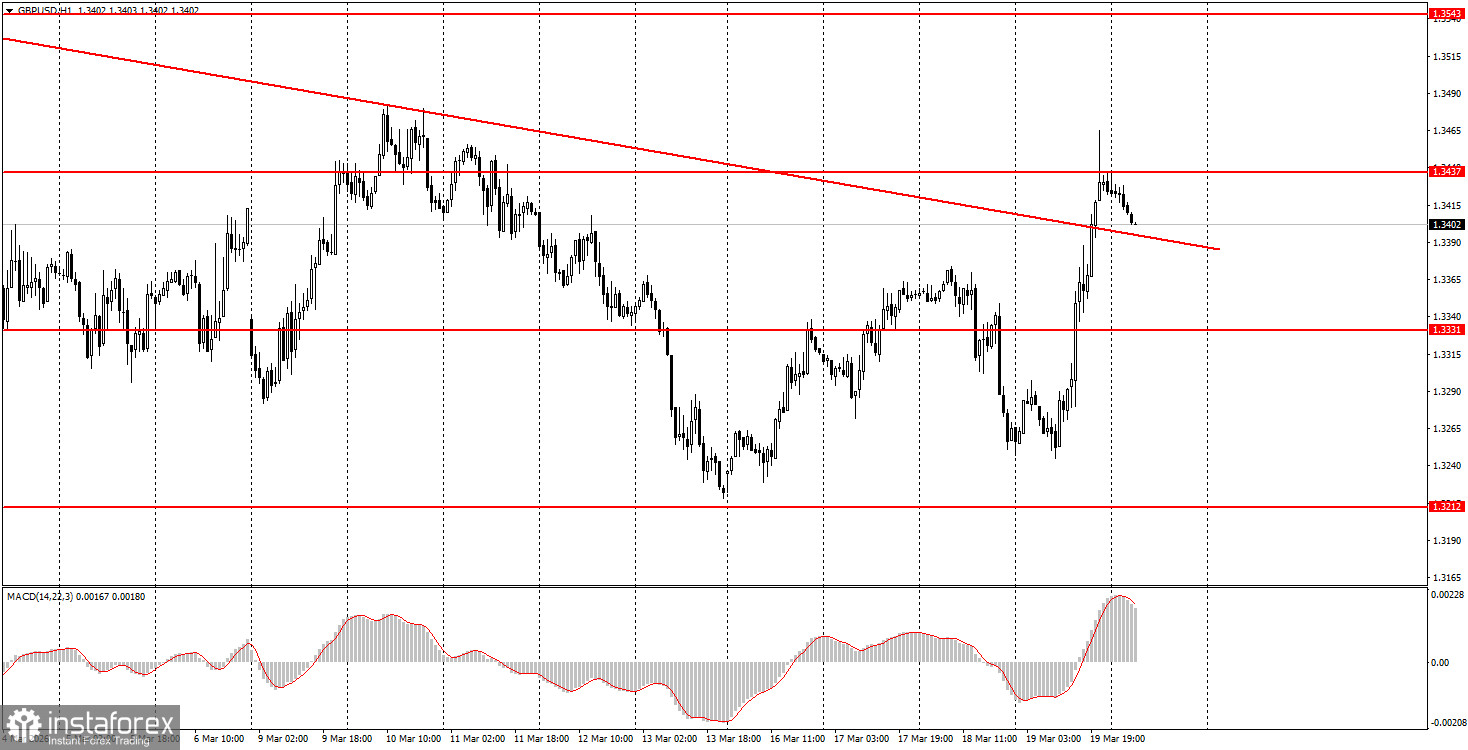
1H Chart of the GBP/USD Pair
The GBP/USD pair rose sharply on Thursday, and the British currency had valid reasons for doing so. A month and a half ago, the Bank of England decided to keep the key interest rate unchanged, but four out of nine governors voted in favor of easing. At that time, the British pound fell sharply, as the market expected only two votes in favor of a rate cut. Yesterday, the BoE decided to keep the key rate unchanged, but this time there were exactly zero votes in favor of easing, although the market again anticipated two "dovish" votes. Therefore, in our view, the rise of the British currency was entirely justified. Moreover, the pound likely contributed to the rise of the euro, as both pairs continue to exhibit a high degree of correlation. Most importantly, the market finally acknowledged the "bullish" factor, having ignored virtually all positive information about the British pound for the past month and a half. The descending trendline has been breached, so from a technical standpoint, growth is also expected.
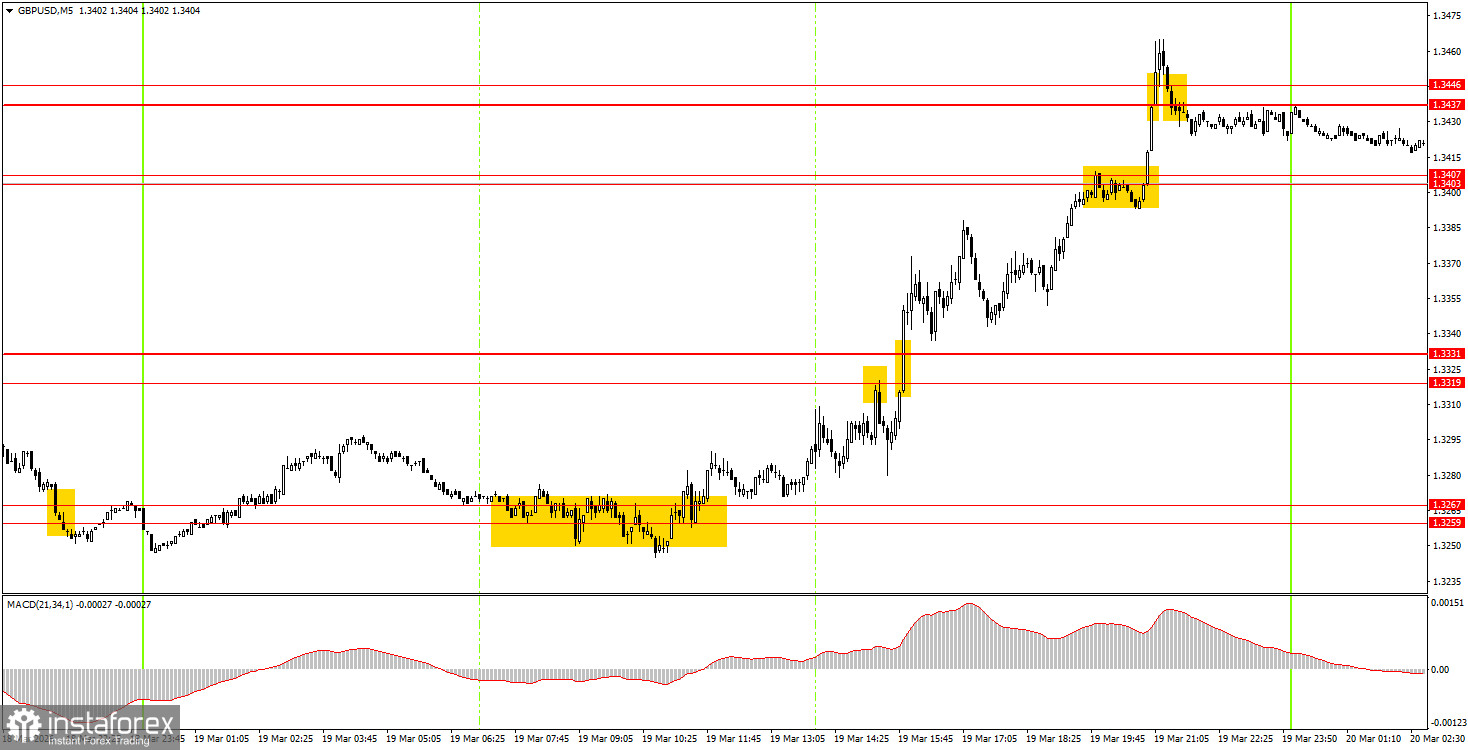
5M Chart of the GBP/USD Pair
On the 5-minute time frame, several decent signals were generated on Thursday. During the European trading session, a buy signal formed in the 1.3259-1.3267 range, leading to prolonged growth. Unfortunately, around 1.3319-1.3331, the price generated a false sell signal. There were no losses from it (the price moved down 20 pips), but it disrupted traders' rhythm, forcing them to close their longs and open shorts. Shortly after, the area of 1.3319-1.3331 was broken, and by the end of the day, the British pound continued to rise. Thus, traders could have made at least 100 pips in profit.
How to Trade on Friday:
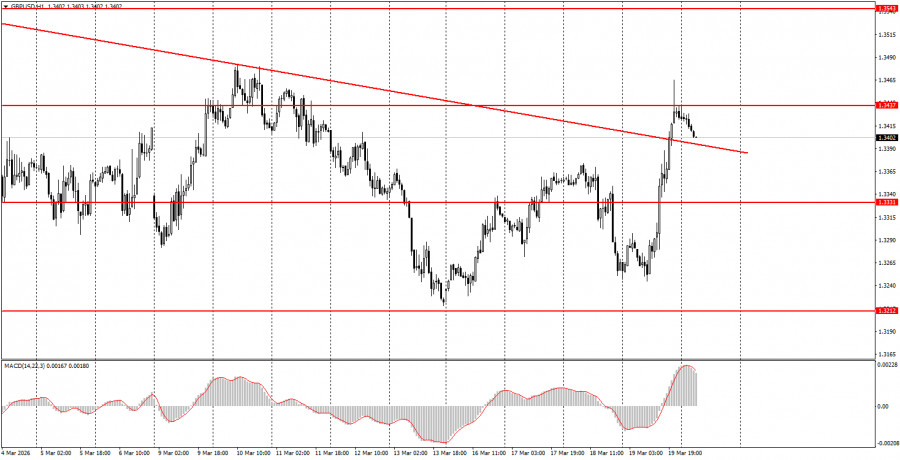
On the hourly time frame, the GBP/USD pair may finally begin to form an upward trend. There are no global grounds for medium-term dollar growth, so we expect a resumption of the global upward trend from 2025 in 2026, which could push the pair to a low of 1.4000. In any case, the market has been completely focused on the war in the Middle East in recent weeks, but this factor cannot support the dollar indefinitely, and there are no other supports for it.
On Friday, novice traders may consider opening short positions if the price consolidates below the 1.3403-1.3407 range, targeting 1.3319-1.3331. A bounce from the area of 1.3403-1.3407 will allow for opening long positions with targets at 1.3437-1.3446 and 1.3484-1.3489.
On the 5-minute time frame, the following levels can be considered: 1.3096-1.3107, 1.3203-1.3212, 1.3259-1.3267, 1.3319-1.3331, 1.3403-1.3407, 1.3437-1.3446, 1.3484-1.3489, 1.3529-1.3543, 1.3643-1.3652, 1.3695, and 1.3741-1.3751. There are no significant events or reports scheduled in the UK or the US on Friday, leaving traders with nothing substantial to react to throughout the day.
Key Principles of the Trading System:
- The strength of a signal is determined by the time it takes to form the signal (bounce or breakout). The less time taken, the stronger the signal.
- If two or more trades have been opened at a particular level based on false signals, all subsequent signals from that level should be ignored.
- In a flat market, any pair can form many false signals or none at all. In any case, at the first signs of a flat trend, it is best to stop trading.
- Trading deals are to be opened during the period between the start of the European session and the mid-American session, after which all trades should be closed manually.
- On the hourly timeframe, it is preferable to trade based on signals from the MACD indicator only when there is good volatility and a trend confirmed by a trend line or trend channel.
- If two levels are positioned too close together (5-20 pips apart), they should be considered a support or resistance area.
- Upon moving 20 pips in the correct direction, a Stop Loss should be set to breakeven.
What to Look for on the Charts:
Price levels of support and resistance are levels that serve as targets when opening buys or sells. Take Profit levels can be placed around them.
Red lines represent channels or trend lines that show the current trend and indicate the direction in which it is preferable to trade now.
The MACD indicator (14,22,3) – the histogram and the signal line – is a supporting indicator that can also be used as a source of signals.
Important speeches and reports (always included in the news calendar) can significantly affect the movement of the currency pair. Therefore, during their release, trading should be done with utmost caution, or traders should exit the market to avoid sharp price reversals against the previous movement.
Beginning traders in the forex market should remember that not every trade can be profitable. Developing a clear strategy and effective money management are the keys to long-term trading success.